Benefit Comparison Charts for Solar Options
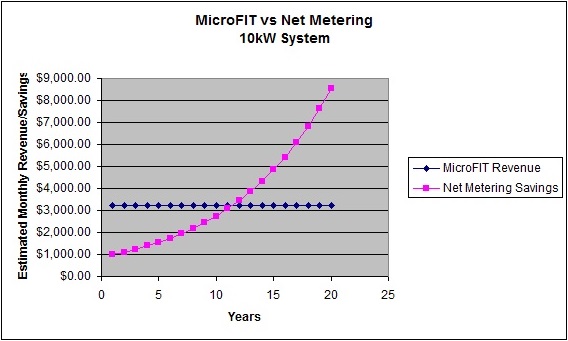
Here we can see that the revenues from a MicroFIT system (Option A: Power goes to grid) start out much higher than the savings on a Net Metering system (Option B: Power goes to you). However we also see that after year 10 the savings of Net Metering surpass the revenue of the MicroFIT system. The average yearly increase in rates over the past 13 years has been 12.5%. We assume a 12.5% increase in electricity rates year over year in this model.
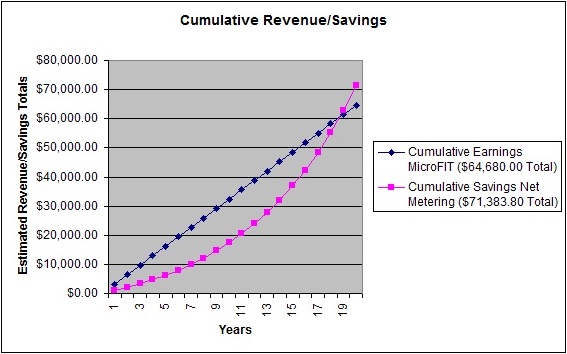
Here we can see the cumulative revenues over a 20 year period from a MicroFIT system (Option A: Power goes to grid) compared to the cumulative savings over the same period from the Net Metering system (Option B: Power goes to you). You will notice that by the end of the term, the savings from Net Metering surpass the revenues of MicroFIT. by approximately $6,700.00. Again we have assumed a 12.5% yearly increase of hydro rates over the 20 year term. In this model we have not accounted for the income tax charged against the MicroFIT revenues.
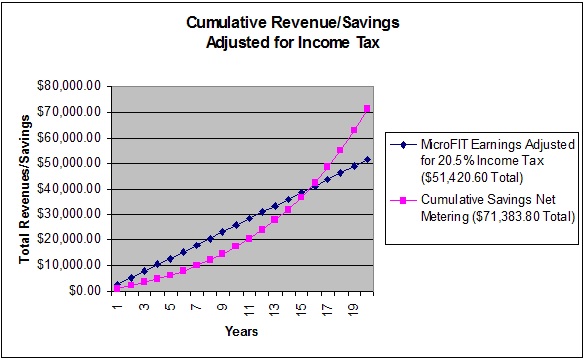
Here we can see a more accurate representation of your net gains/savings under each option. You will notice that with income tax taken into consideration the Net Metering system (Option B: Power goes to you) outperforms the MicroFIT system (Option A: Power goes to grid) by approximately $20,000.00 over the 20 year term. In this model we have not accounted for the business tax write offs for available for Net Metering business owners, the $1000.00 fee to set up a MicroFIT system or the 2nd monthly account fees charged by your utility company.